代碼如下
webfig1.py
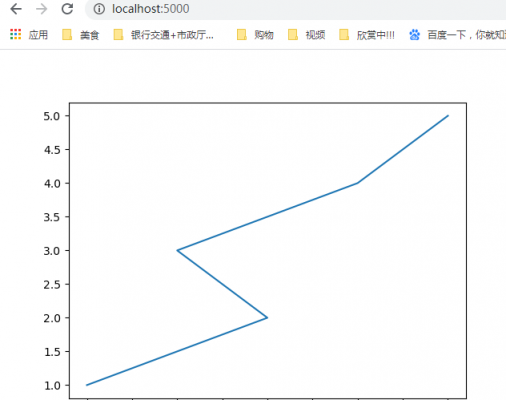
from flask import Flask from flask import render_template import matplotlib.pyplot as plt import io import base64 app = Flask(__name__) @app.route('/') def build_plot(): img = io.BytesIO() y = [1,2,3,4,5] x = [0,2,1,3,4] plt.plot(x,y) plt.savefig(img, format='png') img.seek(0) plot_url = base64.b64encode(img.getvalue()).decode() return render_template('plot.html', plot_url=plot_url) if __name__ == '__main__': app.debug = True app.run()
plot.html
Plot
先用py繪製了xy的圖像,然後經過幾個命令,讓其轉化為plot_url,在傳給plot.html,就可以了
代碼在github:https://github.com/qingnvsue/flask中的webfig文件夾
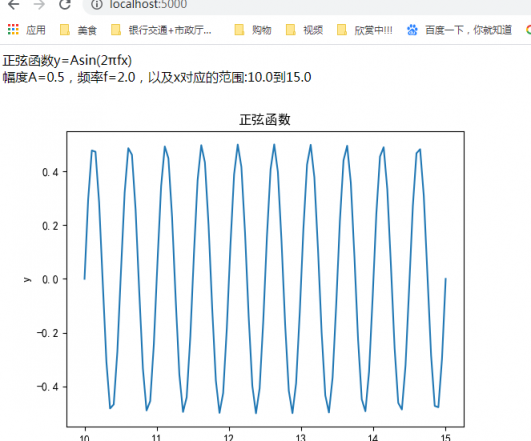
我自己的程序是在網頁輸入sin函數的幅度,頻率,自變量範圍等,然後繪製這個sin函數,讓其顯示到web頁面,如圖

代碼在github:https://github.com/qingnvsue/flask中的sin文件夾
[e36605 ] Python flask框架如何顯示圖像到web頁面已經有434次圍觀
