使用 Perl 和 Imager 模塊增強地圖繪製應用程序,方法是根據顏色提取和應用高度信息以顯示第三維數據,從而在同一個空間中顯示更多信息。
最近出現的應用程序極大地簡化了開發並使 2-D 地圖更加普遍。Microsoft® Live Search Maps 和 Google Maps 等工具將提供增強這些單平面地圖的大量工具,但是通常忽略將高度作為第三維信息。本文將提供工具和代碼以允許您根據像素顏色提取高度信息,並且跨地圖上下文應用高度信息。最終得到第三維數據,從而在同一個空間中顯示更多信息並為地圖用戶提供了一種新的顯示方法。
本文將演示如何使用 Imager Perl 模塊來讀取和處理圖像,從而為源圖像創建單像素級別的高度段。用 Keyhole 標記語言(Keyhole Markup Language,KML)組合這些圖像片段,而 Google Earth 將顯示新數據集的近似體積顯示效果。
硬體和軟體要求
您將需要一台現代計算機才能運行 Google Earth,包括使用 3-D 加速器獲得合適的效果。用 Imager 處理大型圖像可能需要耗費一些時間,因此擁有快速的處理器和大量 RAM 十分有用。
除了 Google Earth 之外,您將需要 Imager Perl 模塊(請參閱 參考資料)以及 Perl 本身。注意,本文提供的所有代碼是跨平台的,並且應當可以在運行 Google Earth 和 Perl 的任何一個平台中運行。
  |
本文中使用的一般方法
為了演示簡介中描述的概念,使用了美國周邊地區的 NOAA 氣象雷達數據。確定每個高度的相關顏色梯度,提取每個像素的高度數據,然後將第二級圖像分層以生成計算出的高度圖像。圖 1 顯示出示例效果。
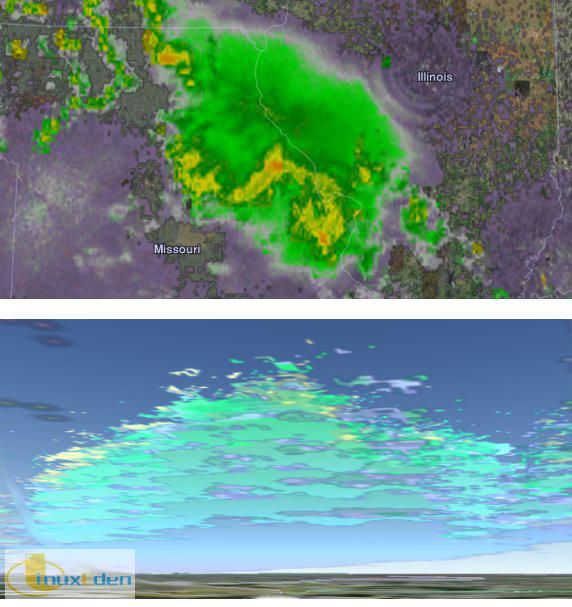
在上面的示例中,頂部圖像顯示了大氣中水量回返的標準 2-D 圖像。底部的圖像顯示了同一個回返圖像,其中根據顯示雲頂高度的第二張圖像映射高度屬性。無論是從很遠的距離查看,還是近地查看,Google Earth 圖像覆蓋顯示將給查看者提供更廣泛的信息。
雖然主要關注 “Echo Tops” 和 “Merged Reflectivity Composite” 圖的雷達返回數據,但是這些技術適用於任意一組平面圖像。
基於顏色提取高度信息
NOAA 為獲取其圖像產品提供了優秀資源,而不是為了數據本身。有關 KML 和圖像文件的鏈接,請參閱 參考資料。在本文中,Echo Tops 圖像將提供高度數據,但是將不生成任何可視的像素。所有可視圖像均來自 “Merged Reflectivity Composite” 圖。圖 2 顯示了雲頂顯示效果及相關的空中高度數據示例。
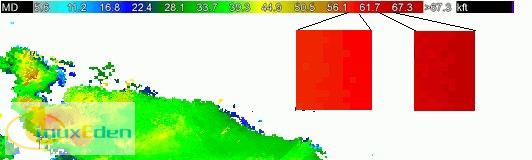
位於左下角的無序斑點是表示來自整張圖像中所選部分的雲頂高度的像素數據。以 kft 為單位的高度信息以及顏色條的放大部分顯示在圖像的頂部。注意多種顏色如何構成漸變的顏色條及其索引值以相對不一致的方式變化。這種不一致性以及在將顏色轉換為高度時缺少可以輕鬆處理的表格,這些是從圖像中提取數據時必須處理的常見問題。最常見的問題是用於生成圖像的原始數據不可用。
創建每個 “顏色區域” 的平均顏色值是通過首次提取圖像右下角中所示的每個顏色區域來執行的。這些色塊是從 Echo Tops key 圖像中提取的,並且另存為 color.tiles/ 目錄中的一系列文件。如果所選數據沒有包含每個高度級別的單個顏色,則需要模擬該過程。確保用可以通過 ls -1 color.tiles/ 命令正確排序的文件名保存文件 — 例如:c00.png、c01.png 等。
|
用 Perl 和 Imager 映射高度
在創建顏色層后,程序的第一步是讀取這些顏色層並生成每個層的平均顏色值。創建名為 altitudeMapper.pl 的文件並插入清單 1 的內容。
#!/usr/bin/perl -w # altitudeMapper.pl - create slices of images based on computed height from # color data in separate image use strict; use Imager; die "specify altitude image, slicee image " unless ( @ARGV == 2 ); my( $fNameAlt, $fNameSli ) = @ARGV; my %cls = (); # color averages my %hgt = (); # height data for each pixel ######## compute the average color for each tile ######## for my $fName ( `ls -1 color.tiles/` ) { chomp($fName); my $tileImage = Imager->new; $tileImage->read(file=>"color.tiles/$fName") or die "cannot open $fName: "; my( $rAvg, $gAvg, $bAvg ) = 0; for( my $colN = 0; $colN <= ($tileImage->getwidth -1); $colN++ ) { for( my $rowN = 0; $rowN <= ($tileImage->getheight -1); $rowN++ ) { my $col2 = $tileImage->getpixel( x=>$colN, y=>$rowN ); my ( $r,$g,$b ) = $col2->rgba(); # count all of the colors for averaging later $rAvg += $r; $gAvg += $g; $bAvg += $b; }#row }#column $cls{ $fName }{ r } = $rAvg / ($tileImage->getwidth * $tileImage->getheight); $cls{ $fName }{ g } = $gAvg / ($tileImage->getwidth * $tileImage->getheight); $cls{ $fName }{ b } = $bAvg / ($tileImage->getwidth * $tileImage->getheight); }#for each color.tiles |
在變數聲明和用法檢查后,將讀取 color.tiles 目錄中的各個顏色區域文件。使用 Imager getpixel 子常式,記錄每個像素的紅、綠和藍顏色組成,程序將在收集了所有數據點後計算其平均值。對於稍後在程序中查找最接近的匹配,這一步至關重要。
代碼的下一部分將讀取 Echo Tops 圖像並根據圖像中每個像素的顏色記錄相應高度設置。
########### Read height data ############## my $altImage = Imager->new; $altImage->read( file=> $fNameAlt ) or die "can't open $fNameAlt: "; my $maxCol = $altImage->getwidth -1; # getwidth is a very slow read my $maxRow = $altImage->getheight -1; # getheight is a very slow read for( my $colN = 0; $colN <= $maxCol; $colN++ ) { for( my $rowN = 0; $rowN <= $maxRow; $rowN++ ) { my $currColor = $altImage->getpixel( x=>$colN, y=>$rowN ); my ($r,$g,$b ) = $currColor->rgba(); # skip if white or black pixel next unless ( "$r,$g,$b" ne "0,0,0" && "$r,$g,$b" ne "255,255,255" ); my $totalDev = 10000; my $closest = "none"; for my $key( keys %cls) { my $devR = abs( $cls{$key}{r} - $r ); my $devG = abs( $cls{$key}{g} - $g ); my $devB = abs( $cls{$key}{b} - $b ); # skip if deviation is greater than currently selected next unless ( ($devR + $devG + $devB) < $totalDev ); $totalDev = $devR + $devG + $devB; $closest = $key; }#for key comparison $hgt{ $closest }{ $colN }{ $rowN } = $currColor; }#row print "$colN\n" if( $colN % 100 == 0 ); # progress indicator }#column |
本例中使用的圖像是 6,000 x 3,000 像素,因此讀取 getwidth 和 getheight 子常式是在 for 循環之前完成的,這樣可以顯著提高速度。然後讀取每個像素,並且通過上一步中記錄的每個平均顏色測量其紅、綠和藍色偏差。在找到最接近的匹配后,該像素的高度設置存儲在 %hgt 散列變數中。現在相應的高度信息已經記錄,允許通過如下所示的第二張圖像創建圖像分層。
############ Apply height data to image ########### my %layer = (); # pixel x,y data for that layer my %avgLev = (); # average colors for that layer my $lev = keys %cls; # number of image components to process my $compImage = Imager->new; $compImage->read( file=>$fNameSli ) or die "Cannot load $fNameSli: "; $maxCol = $compImage->getwidth -1; # getwidth is a very slow read $maxRow = $compImage->getheight -1; # getheight is a very slow read # process the layers from top to bottom for my $key( reverse sort keys %cls ) { my $imgOut = Imager->new; $imgOut->read( file=>"images/blank6000x3000.png") or die "blank image borked"; for( my $colN = 0; $colN <= $maxCol; $colN++ ) { for( my $rowN = 0; $rowN <= $maxRow; $rowN++ ) { # if layer data exists, and not on the top level if( exists($layer{ $colN }{ $rowN }) && ($lev < (keys %cls)) ) { # the color average from the previous layer my $newColor = Imager::Color->new( $avgLev{ $lev+1 }{ r }, $avgLev{ $lev+1 }{ g }, $avgLev{ $lev+1 }{ b } ); $imgOut->setpixel( x=>$colN, y=>$rowN, color=>$newColor ); }#set to previous layer if exists |
在聲明變數並且打開要 “分層” 的圖像后,將處理 %hgt 散列中的每個層。imgOut 變數將保存用於像素布置的透明 6,000 x 3,000 畫布,並在每次傳遞結束時寫入磁碟中。如果上面一層存在層數據(並且之上還有一層),則先前層的這些平均顏色數據將被寫入輸出圖像。這將確保圖像中沒有 “缺口”,其中較低的圖層將不包含來自較高圖層的相應圖像。如您在圖 1 中所見,底層是一致的顏色,即使較高圖層包含不同的黃色和綠色梯度。填充這些缺口是將平面圖轉換為更適合 3-D 環境的顯示效果的要求之一。
如果該圖層的數據存在於 $fNameSli(Merged Reflectivity Composite)圖像中,則清單 4 將重寫這些先前的圖層像素。
# copy pixels from the original image if height data exists for this layer if( exists( $hgt{ $key }{ $colN }{ $rowN } ) ) { my $currColor = $compImage->getpixel( x=>$colN, y=>$rowN ); my($r, $g, $b) = $currColor->rgba(); $imgOut->setpixel( x=>$colN, y=>$rowN, color=>$currColor ); $layer{ $colN }{ $rowN } = $currColor; $avgLev{ $lev }{ r } += $r; $avgLev{ $lev }{ g } += $g; $avgLev{ $lev }{ b } += $b; $avgLev{ $lev }{ count } ++; }# if height data exists for that pixel }#row }#column |
除了從 $fNameSli 圖像中複製像素之外,將記錄該像素的顏色數據以供計算平均值。這將確保從較高圖層填充缺口的每一塊的顏色背景都是統一的。清單 5 將輸出最終圖像並計算每個圖層顏色值的平均值。
print "write tiles/$key\n"; $imgOut->write( file=>"tiles/$key", type=>"png") or die "can't write $key"; # compute color averages for this level if( exists( $avgLev{ $lev }{ count } ) ) { $avgLev{ $lev }{ r } = $avgLev{ $lev }{ r } / $avgLev{ $lev }{ count }; $avgLev{ $lev }{ g } = $avgLev{ $lev }{ g } / $avgLev{ $lev }{ count }; $avgLev{ $lev }{ b } = $avgLev{ $lev }{ b } / $avgLev{ $lev }{ count }; }#if layer exists $lev--; }#for each key |
注意,$fNameSli(Merged Reflectivity Composite)像素的平均顏色記錄在每個圖像坐標的 %avgLev 散列中。某些像素顏色可以呈現到不在 $fNameSli 圖像中的顏色區域層中,並且這種平均有助於更好地顯示沒有精確匹配顏色的圖像。
|
altitudeMapper.pl 用法
在 altitudeMapper.pl 代碼就緒后,您需要為分層圖像和輸出圖像創建目錄,並且創建源透明圖像。清單 6 的前三行顯示了必須使用的命令。
mkdir images mkdir tiles convert -size 6000x3000 xc:none images/blank6000x3000.png # or create with The Gimp perl altitudeMapper.pl \ images/EchoTop_18_20080725-061737.png \ images/MergedReflectivityComposite_20080725-061750.png |
清單 6 中的最後三行將顯示 altitudeMapper.pl 程序本身的用法。注意,\ 字元表示用于格式化目的的換行符。第一張圖像是雲頂數據,而第二張圖像是要劃分層次的源數據。
|
生成 KML
您可以瀏覽位於 tiles 目錄中的輸出圖像文件,也可以繼續查看清單 7。
#!/usr/bin/perl -w # kmlGenerator.pl - create kml for sliced images created by altitudeMapper.pl use strict; die "specify starting altitude, layer distance" unless @ARGV==2; my ( $alt, $distance ) = @ARGV; my $drawOrder = 1; print qq{<?xml version="1.0" encoding="UTF-8"?> \n}; print qq{<kml xmlns="http://earth.google.com/kml/2.0"> \n}; print qq{<Folder> \n}; print qq{ <name>kmlGenerator output</name>\n}; while( my $line = <STDIN> ) { chomp($line); print " <GroundOverlay>\n"; print " <drawOrder>$drawOrder</drawOrder>\n"; print " <Icon><href>$line</href></Icon>\n"; print " <altitude>$alt</altitude>\n"; print " <altitudeMode>absolute</altitudeMode>\n"; print " <name>$drawOrder</name>\n"; print " <LatLonBox>\n"; print " <north>51.000</north>\n"; print " <south>21.000</south>\n"; print " <east>-67.000</east>\n"; print " <west>-127.000</west>\n"; print " </LatLonBox>\n"; print " </GroundOverlay>\n"; $drawOrder++; $alt += $distance; }#while line in print "</Folder>\n"; print "</kml>\n"; |
kmlGenerator.pl 程序將圍繞分層圖像封裝相應的 KML。圖層之間的起始高度和距離的各種組合將在特定的距離和視角上生成不同的體積效果。清單 8 將用生成圖 1 底部所示圖像所使用的參數演示程序用法。
ls -1 tiles/* | perl kmlGenerator.pl 20000 10000 > kmlOutput.kml |
在 Google Earth 中打開 kmlOutput.kml 文件,查看新的增強了高度屬性的圖像。
|
結束語
可以看到,根據獨立圖像中的圖像數據將圖像劃分為特定組成,可以將第三維數據有效地添加到先前的平面顯示效果中。這些顏色平均和圖層填空技巧只是實現類似效果的其中一種方法。考慮繪製跟蹤高度等於雲頂的特定圖層邊緣的多邊形。或者,添加與地平面垂直的、計算出透明度的透明圖形,創建針對所有視角的更真實的分層效果。(責任編輯:A6)
[火星人 ] 用高度屬性增強 Google Earth 中的圖像覆蓋圖已經有704次圍觀
