1.在搭建網絡開始時,會調用到 keras.models的Sequential()方法,返回一個model參數表示模型
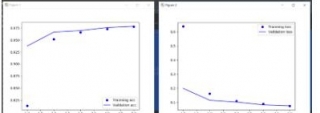
2.model參數裡面有個fit()方法,用於把訓練集傳進網絡。fit()返回一個參數,該參數包含訓練集和驗證集的準確性acc和錯誤值loss,用這些數據畫成圖表即可。
如:
history=model.fit(x_train, y_train, batch_size=32, epochs=5, validation_split=0.25) #獲取數據 #########畫圖 acc = history.history['acc'] #獲取訓練集準確性數據 val_acc = history.history['val_acc'] #獲取驗證集準確性數據 loss = history.history['loss'] #獲取訓練集錯誤值數據 val_loss = history.history['val_loss'] #獲取驗證集錯誤值數據 epochs = range(1,len(acc)+1) plt.plot(epochs,acc,'bo',label='Trainning acc') #以epochs為橫座標,以訓練集準確性為縱座標 plt.plot(epochs,val_acc,'b',label='Vaildation acc') #以epochs為橫座標,以驗證集準確性為縱座標 plt.legend() #繪製圖例,即標明圖中的線段代表何種含義 plt.figure() #創建一個新的圖表 plt.plot(epochs,loss,'bo',label='Trainning loss') plt.plot(epochs,val_loss,'b',label='Vaildation loss') plt.legend() ##繪製圖例,即標明圖中的線段代表何種含義 plt.show() #顯示所有圖表
得到效果:
完整代碼:
import keras from keras.datasets import mnist from keras.layers import Conv2D, MaxPool2D, Dense, Flatten,Dropout from keras.models import Sequential import matplotlib.pyplot as plt (x_train, y_train), (x_test, y_test) = mnist.load_data() x_train = x_train.reshape(-1, 28, 28, 1) x_test = x_test.reshape(-1, 28, 28, 1) x_train = x_train / 255. x_test = x_test / 255. y_train = keras.utils.to_categorical(y_train) y_test = keras.utils.to_categorical(y_test) model = Sequential() model.add(Conv2D(20,(5,5),strides=(1,1),input_shape=(28,28,1),padding='valid',activation='relu',kernel_initializer='uniform')) model.add(MaxPool2D(pool_size=(2,2),strides=(2,2))) model.add(Conv2D(64,(5,5),strides=(1,1),padding='valid',activation='relu',kernel_initializer='uniform')) model.add(MaxPool2D(pool_size=(2,2),strides=(2,2))) model.add(Flatten()) model.add(Dense(500,activation='relu')) model.add(Dropout(0.2)) model.add(Dense(10,activation='softmax')) model.compile('sgd', loss='categorical_crossentropy', metrics=['accuracy']) #隨機梯度下降 history=model.fit(x_train, y_train, batch_size=32, epochs=5, validation_split=0.25) #獲取數據 #########畫圖 acc = history.history['acc'] #獲取訓練集準確性數據 val_acc = history.history['val_acc'] #獲取驗證集準確性數據 loss = history.history['loss'] #獲取訓練集錯誤值數據 val_loss = history.history['val_loss'] #獲取驗證集錯誤值數據 epochs = range(1,len(acc)+1) plt.plot(epochs,acc,'bo',label='Trainning acc') #以epochs為橫座標,以訓練集準確性為縱座標 plt.plot(epochs,val_acc,'b',label='Vaildation acc') #以epochs為橫座標,以驗證集準確性為縱座標 plt.legend() #繪製圖例,即標明圖中的線段代表何種含義 plt.figure() #創建一個新的圖表 plt.plot(epochs,loss,'bo',label='Trainning loss') plt.plot(epochs,val_loss,'b',label='Vaildation loss') plt.legend() ##繪製圖例,即標明圖中的線段代表何種含義
[月球人 ] 使用Keras畫神經網絡準確性圖教程已經有270次圍觀
